Total users
The Total Users chart shows the number of unique users who interacted with Algolia Recommend. By default, Algolia distinguishes users by their IP address. For a more accurate count, see Set the analytics user token. This is especially important if you call the Recommend API from your backend.Total recommendations
The Total Recommendations chart shows how often your users requested recommendations in the selected date range. By default, all Recommend requests are counted for analytics purposes. To exclude a request, set the parameteranalytics to false.
Click-through rate
The Click-through Rate chart shows the percentage of tracked recommendations with at least one click event. A tracked recommendation is one with theclickAnalytics parameter set to true.
If a single recommendation generates multiple click events,
it’s counted the same as if it generates one click event.
Algolia doesn’t distinguish between different click event types and calculates one click-through rate for each record.
To calculate the click-through rate,
you need to send click events.
Conversion rate
The Conversion Rate chart shows the percentage of tracked recommendations with at least one conversion event. A tracked recommendation is one with theclickAnalytics parameter set to true.
If a single recommendation generates multiple conversion events,
it’s counted the same as if it generates one conversion event.
Algolia doesn’t distinguish between different types of conversions and calculates one conversion rate for each record.
To calculate the conversion rate,
you need to send conversion events.
Add-to-cart rate
The Add-to-cart Rate chart shows the percentage of tracked recommendations with at least one conversion event with theaddToCart eventSubtype.
A tracked recommendation is one with the clickAnalytics parameter set to true.
To calculate the add-to-cart rate, you need to send addToCart conversion events.
The add-to-cart rate is an aggregated rate across all currencies, rather than per currency.
This feature isn’t available on every plan.
Refer to your pricing plan to see if it’s included.
Purchase rate
The Purchase Rate chart shows the percentage of tracked recommendations with at least one conversion event with thepurchase eventSubtype.
A tracked recommendation is one with the clickAnalytics parameter set to true.
The purchase rate is an aggregated rate across all currencies, rather than per currency.
To calculate the purchase rate, you need to send purchase conversion events.
This feature isn’t available on every plan.
Refer to your pricing plan to see if it’s included.
Revenue
The Revenue chart shows the revenue generated by tracked recommendations with thepurchase eventSubtype for a given currency.
A tracked recommendations is one with the clickAnalytics set to true.
The revenue is calculated as the sum of the price multiplied by quantity for each object in the event’s objectData array.
To aggregate and display the revenue, you must define revenue events.
Revenue is calculated per-currency.
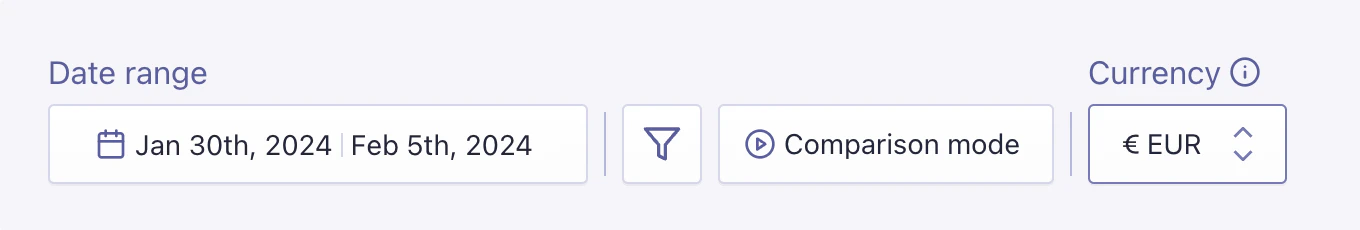
The currency selector at the top of the page lets you switch between currencies.
Changing currencies doesn’t affect the purchase or add-to-cart rates.
The currency selector isn’t shown if no valid revenue events are detected.
This feature isn’t available on every plan.
Refer to your pricing plan to see if it’s included.
Average order value
The Average order value chart shows the average order value of tracked recommendations with at least onepurchase eventSubtype for a given currency.
A tracked recommendations is one with the clickAnalytics set to true.
The average order value is the revenue divided by the transactionCount for a given currency.
Click position
The Click Position distribution shows the position of recommendations with clicks. Smaller values are better since they indicate that users clicked top results. Consider the following click events:- First recommendation: 2 clicks
- Third recommendation: 1 click
- Tenth recommendation: 1 click