Performance metrics
To monitor the performance of the Algolia API for your application:- Go to the Algolia dashboard and select your Algolia .
- On the left sidebar, select API Monitoring.
-
Open the Performance page.
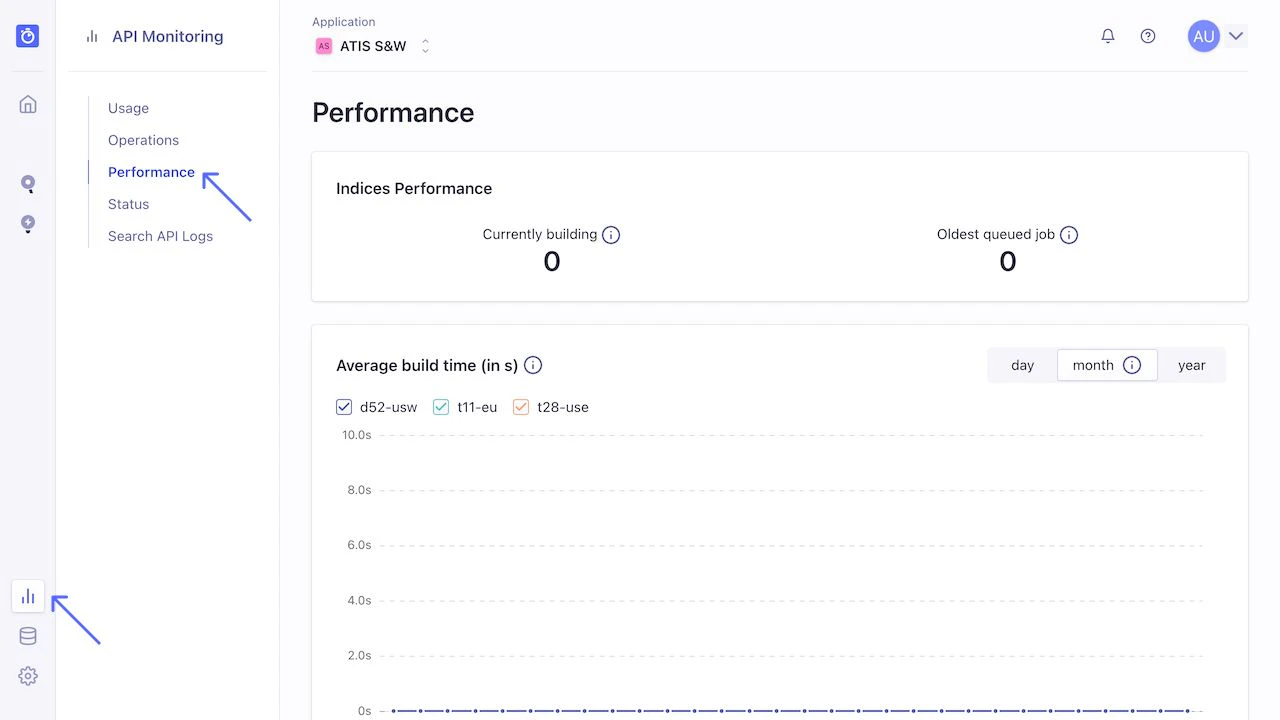
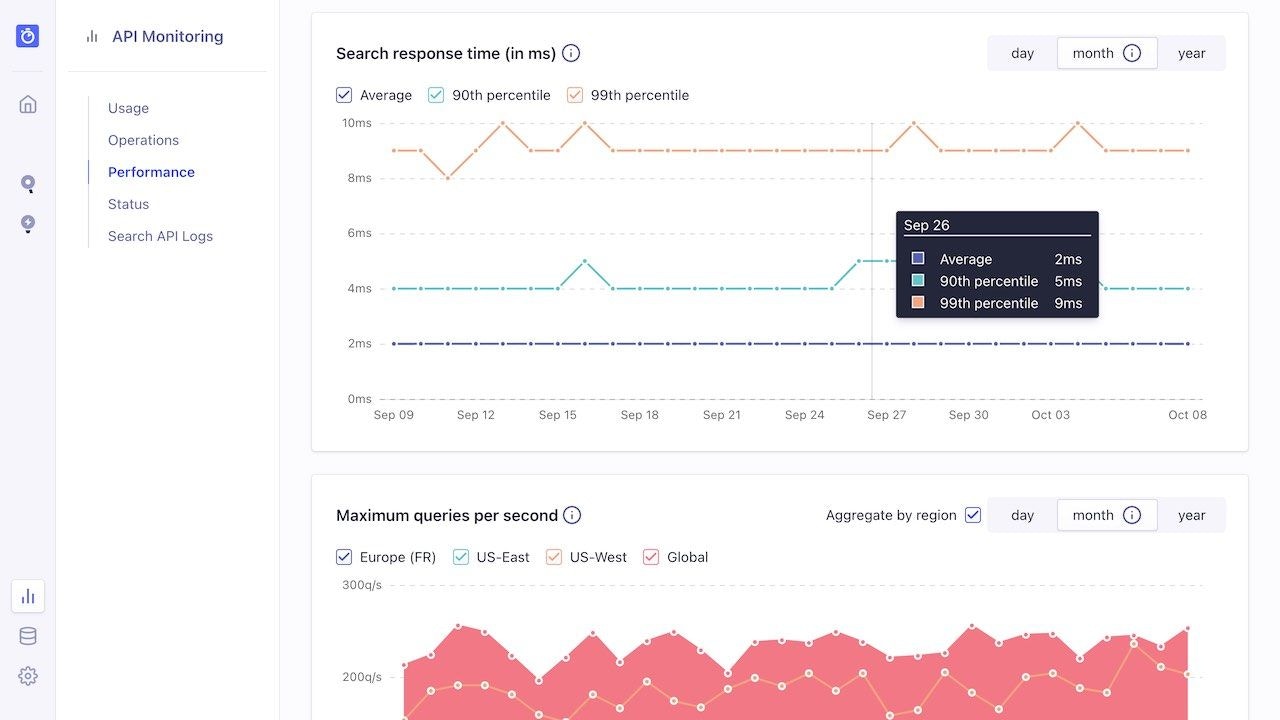
Speed
Algolia measures speed in milliseconds. Larger values might indicate a performance problem. Since processing time only measures the speed of the Algolia servers, you need to add network latency and frontend display times to measure the full user experience. Delivering the best UX means that the total time, from keystroke to displaying search results, should be less than 100 ms, as this delivers a real search as you type experience. Thus, with this 100 ms benchmark, and an average latency of 70 ms, the engine’s processing time should be no greater than 30 ms, and ideally a lot lower.Usage activity
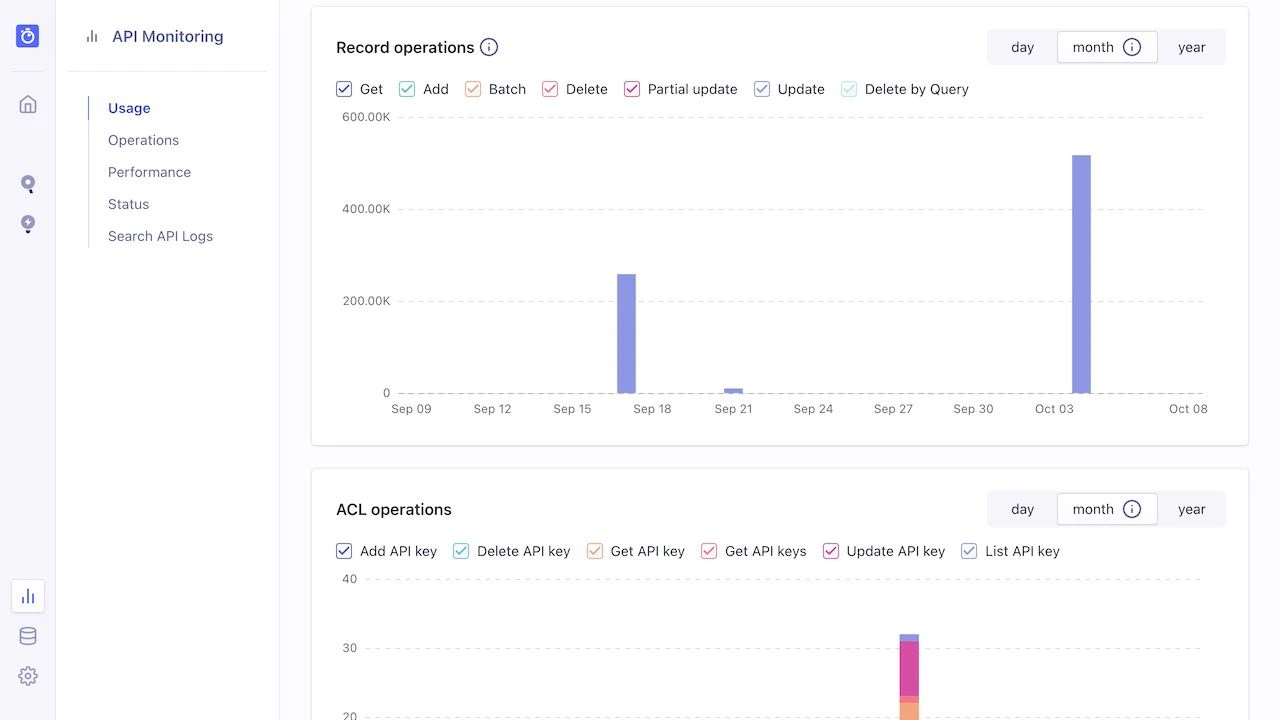
Open the Usage page to see the total number of records, and the number of search and indexing operations for the current billing cycle. The Records graph always shows your monthly usage, whether you have a monthly or annual subscription.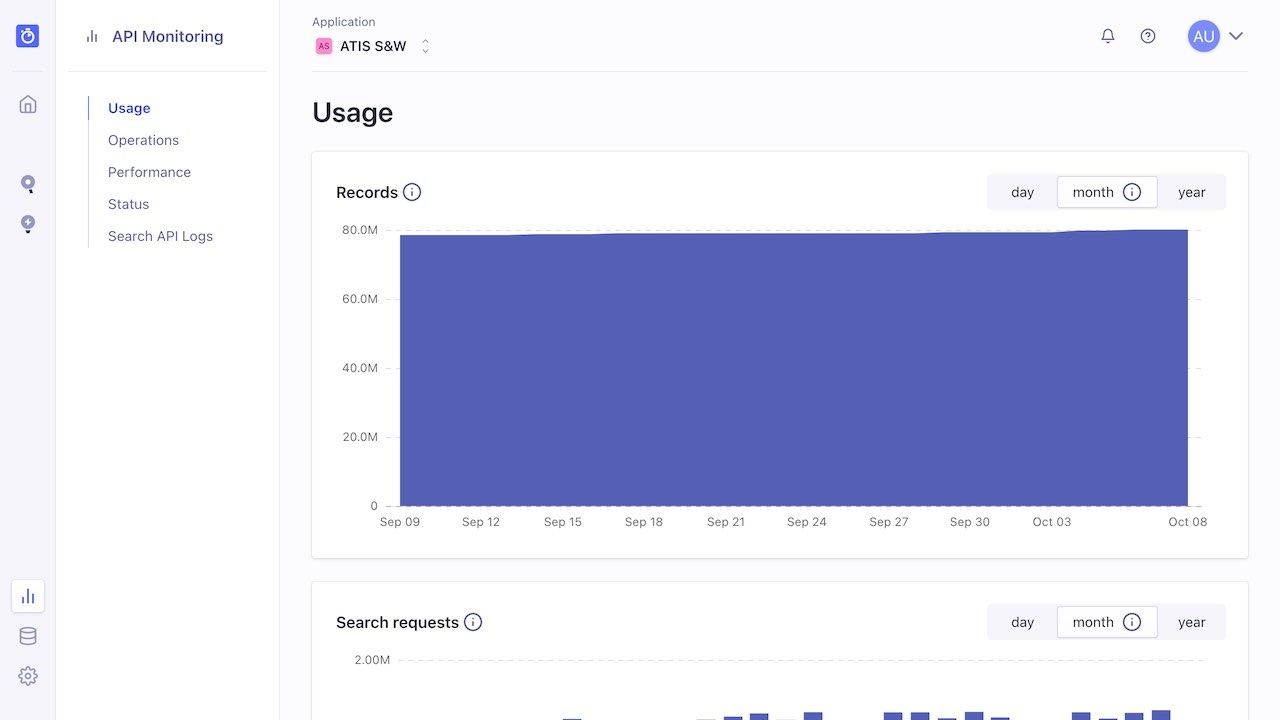
The usage statistics don’t include indexing operations on replicas.
Algolia keeps replicas in sync internally.
Status page
The Status page includes information about the availability of your Algolia servers and clusters. The same information is also available at https://status.algolia.com/.Incidents
At the top, you’ll see all recent incidents, such as, issues with processing API requests. Any incident with a green circle and the message “Everything operating normally” is resolved.Availability
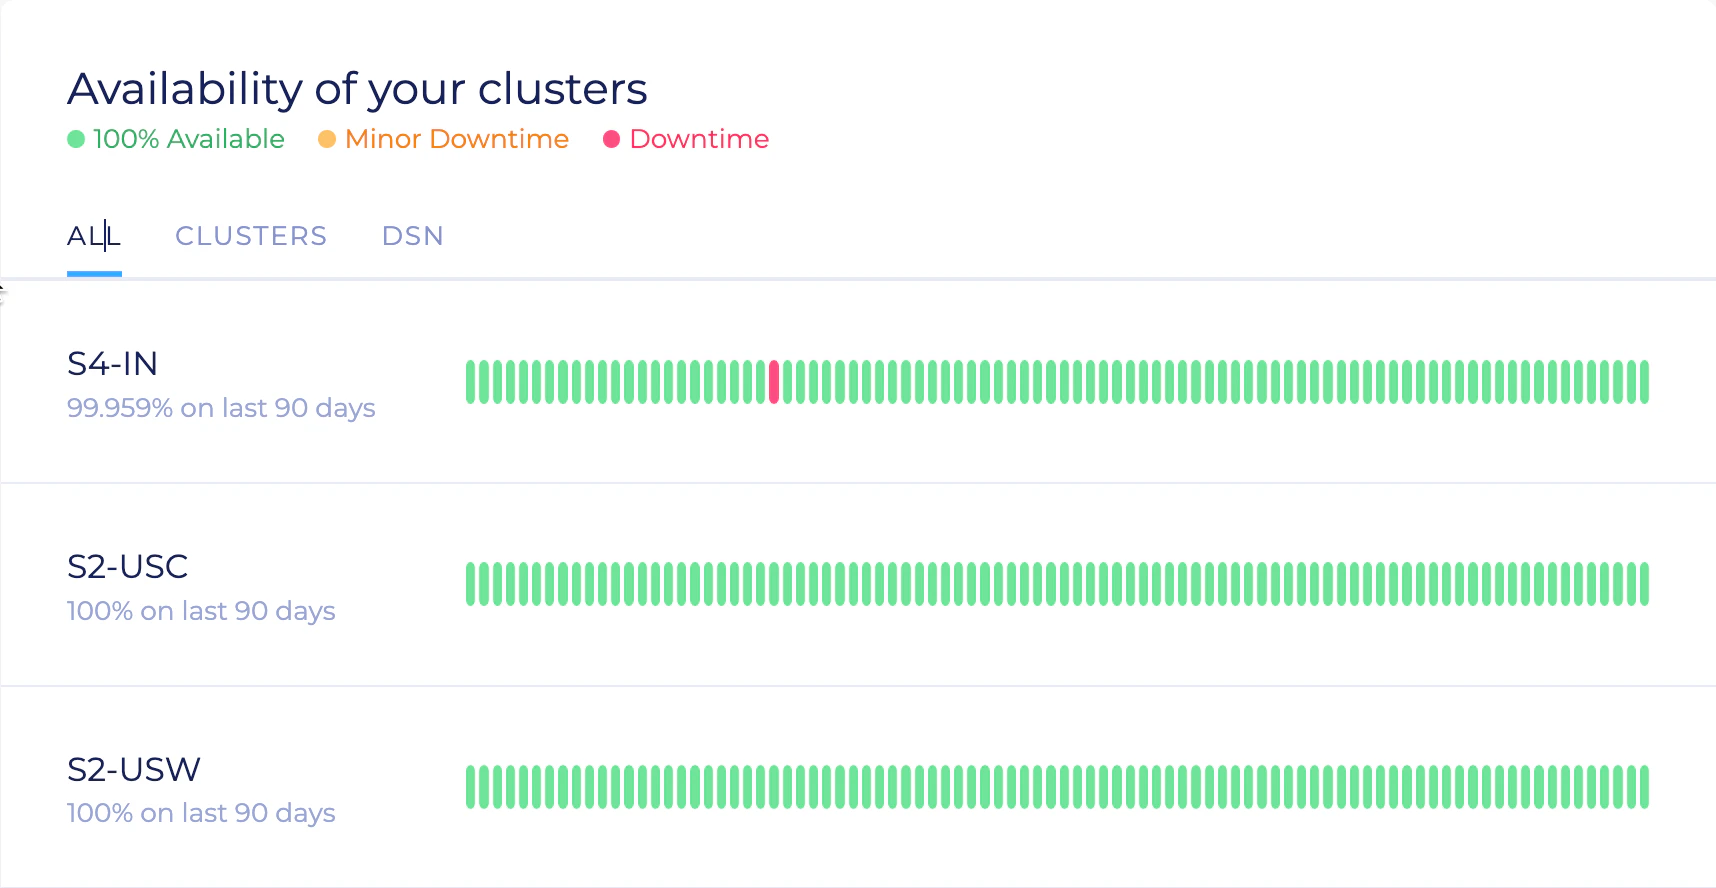
- If one server goes down, the cluster operates normally. The status shows 100% availability (green).
- If a second server goes down, the remaining server still processes all search requests. Indexing operations are added to a queue and will be processed after the cluster returns to “green”. This status is shown as Minor downtime (yellow).
- If all three servers are down, the whole cluster is down. This is shown as Major downtime (red).
Latest operations
In the Search API Logs section, you can watch operations as they occur on Algolia’s servers.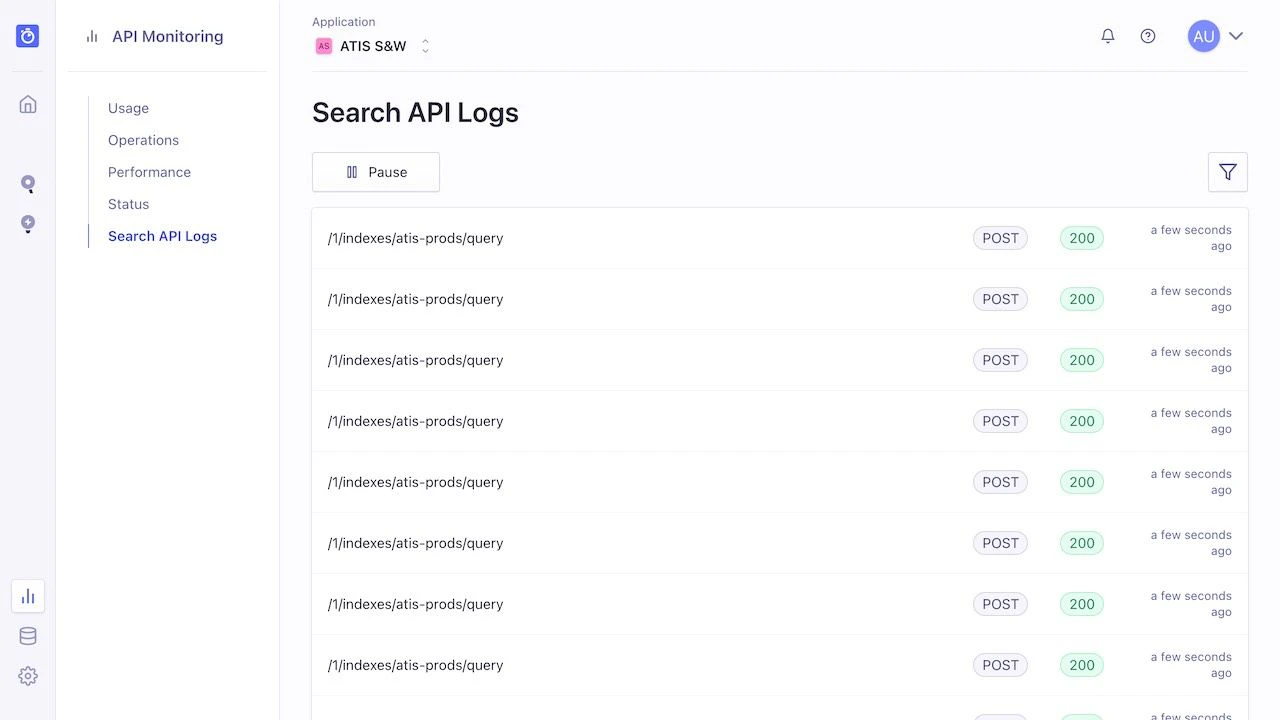
Alerts
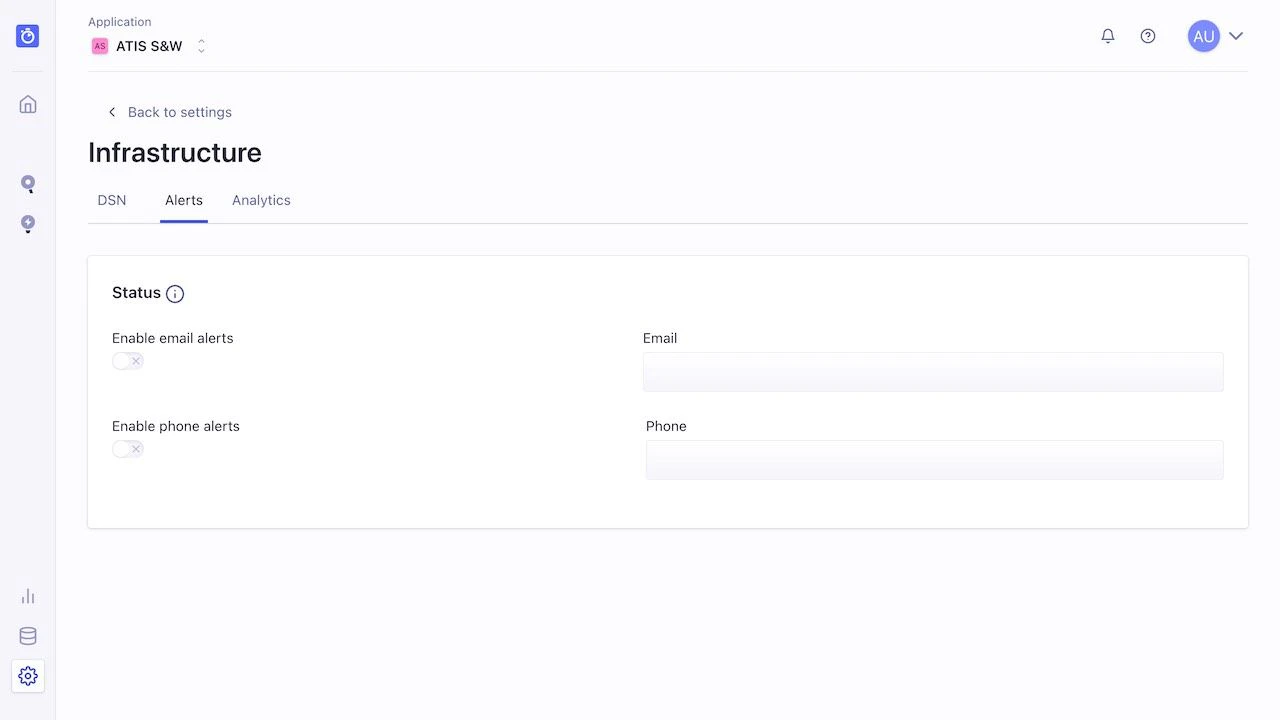
- Status. Configure an email or a phone number to receive incident reports as they occur.
- Capacity. Configure one or more alerts to warn you before your servers consume too much memory or CPU. For more information, see Capacity alerts.
You can set up capacity alerts only if you’re on a plan with dedicated servers.