Though this tutorial focuses on star ratings,
this solution can work with any product scoring system.
For example, you could compute the Bayesian average for the number of up and down votes,
or scores based on the number of sells or views.
Concepts
The challenges with star ratings and how the Bayesian average has become the preferred method for ranking by star ratings.The difficulties with calculating a reliable rating
Creating a meaningful ranking strategy based on ratings can be challenging. Is only one rating enough? Or do you need a certain quantity of ratings for the ratings to be reliable? Is a product with ratings ranging from 1 to 5 (in a 5-star rating system) better than a product with a smaller number of positive ratings? Obviously, a product that receives only 5 stars is a good choice, but is it better than a popular item with hundreds of 4 stars? A good example is the query “lion” on a movie streaming site. Should the movie “The Lion King” rank above a higher-rated but lesser known film like “The Lion in Winter”? Suppose that “The Lion King” has an average of 4.5 stars but “The Lion in Winter” has a higher average of 4.8. If the 4.5 average rating comes from 10,000 ratings and the 4.8 average rating from 100 ratings, which movie should show up first? The challenge with any rating system—whether for handbags, electronics, or movies—is that the quantity of ratings is as important as the rating itself. Intuitively, the more ratings received, the more confidence you can have in the rating. But again, how large should the sample size be before you can trust that the rating is meaningful?Different ratings comparison
Consider two ways to rank star ratings:- Use an arithmetic average that adds together all ratings and divides by the total quantity of ratings. If there are 100 1-star ratings and 10 5-star ratings, the calculation is ((100x1) + (10x5))/ (100+10) = 1.36.
- Use a Bayesian average that adjusts a product’s average rating by how much it varies from the catalog average. This favors products with a higher quantity of ratings.
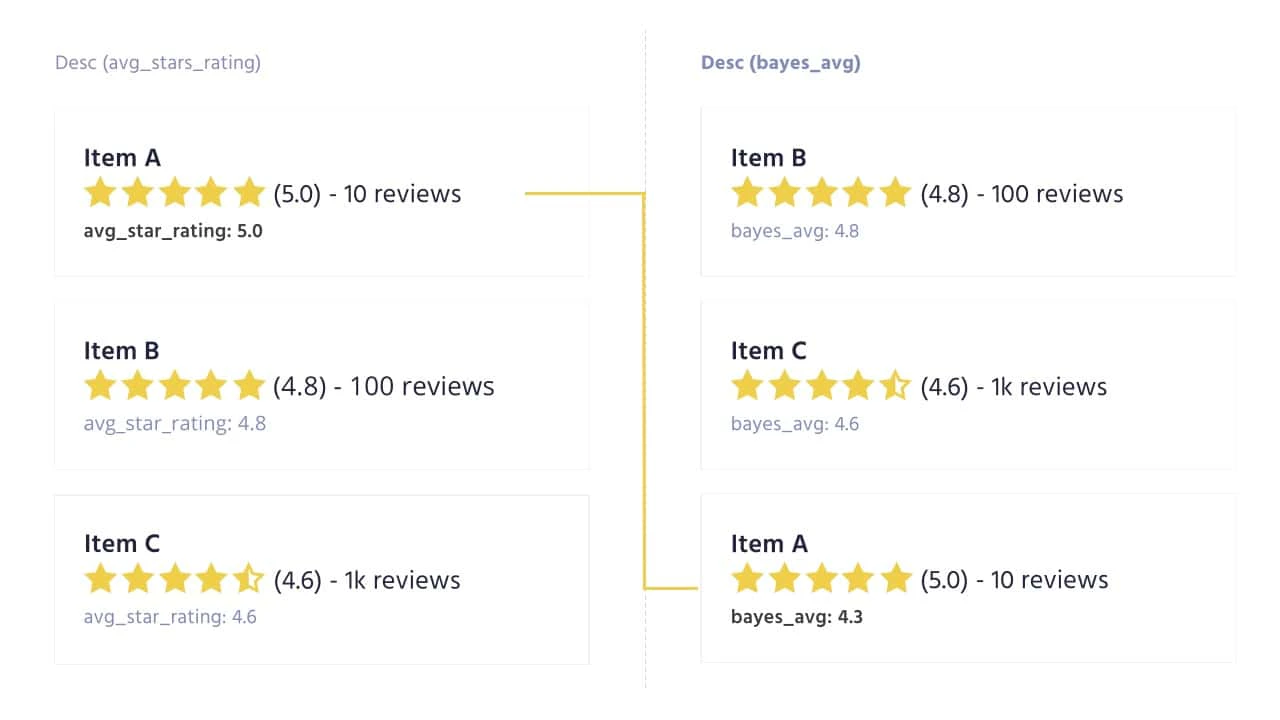
avg_star_rating and bayes_avg respectively, under each item.
By putting Item A at the top, the left side’s ranking is both misleading and unsatisfying.
The ranking on the right, based on the Bayesian average, reflects a better balance of rating and quantity of ratings.
This example shows how the Bayesian average lowered item A’s average to 4.3 because it measured A’s 10 ratings against B and C’s much larger numbers of ratings. As described later, the Bayesian average left Items B and C unchanged because the Bayesian average affects items with low rating counts much more then those that have more ratings.
In sum, by relativizing ratings in this way,
the Bayesian average creates a more reliable comparison between products.
It ensures that products with lower numbers of ratings have less weight in the ranking.
What follows is a description of the Bayesian average and how to code it.
Bayesian averages
The Bayesian average adjusts the average rating of products whose rating counts fall below a threshold. Suppose the threshold amount is calculated to be 100. That means average ratings with less than 100 ratings get adjusted, while average ratings with more than 100 ratings change only slightly. This threshold amount of 100 is called a confidence number, because it gives you confidence that averages with 100 or more ratings are more reliable than averages with fewer than 100 ratings. This confidence number derives from the catalog’s distribution of rating counts and the average rating of all products. By factoring in ratings counts and averages from the whole catalog, the Bayesian average has the following effect on an item’s individual average rating:- For an item with a fewer than average quantity of ratings, the Bayesian average lowers its artificially high rating by weighing it down (slightly) to the lower catalog average.
- For an item with a lot of ratings (that is, more than the threshold), the Bayesian average doesn’t change its rating average by a significant amount.
How to calculate the Bayesian average
The Bayesian average uses two constants to offset the arithmetic average of an individual product:- The arithmetic average rating of all products (
m) - A confidence number (
C).
m is a straightforward arithmetic average for all products: the sum of all ratings divided by the count of quantity of ratings.
Calculating C requires a bit more math. This tutorial calculates C based on the distribution of the rating counts for each product, where C is equal to the 25% percentile (= the lower quartile). For example, suppose a store has 100 products. To compute C, you take all the products and sort them by the quantity of ratings each has. Some have 10 ratings and others have 100 or 1000 ratings. Once sorted, you find the product at the 25% position on the sorted list and note the number of ratings it has. This is the lower quartile for C. For simplicity, this guide sets C = 100.
Thus, if you calculate the overall average rating (m) of the store’s catalog to be 3.5,
the Bayesian average uses both of these values ( m = 3.5 and C = 100) to adjust the arithmetic average.
It does this using the following formula:
Here’s the same formula with the example numbers plugged in:
Compute the Bayesian average
The following shows how to code the Bayesian constants (m and C) and the Bayesian average itself.
It also discusses when to calculate these values.
Necessary attributes in your index
You need a dataset of products where each product has at least these three attributes:- The product’s arithmetic average rating (
avg_stars_rating) - The product’s Bayesian average (
bayes_average), this can be empty or0to start - The quantity of ratings (
ratings_count)
JSON
This JSON already includes a
bayes_average attribute.
The purpose of the following code is to calculate the value for bayes_average.Additionally, the sample dataset doesn’t show other attributes, such as the description of the product, price, item specifications, etc.Bayesian constants
The variablesm and C represent the two Bayesian constants.
In this code, they’re assigned the values from the preceding section (m = 3.5 and C = 100):
JavaScript
C constant in different ways.
As suggested in the preceding section, you can use a lower quartile % that corresponds to the 25% percentile.
You can calculate this value using the following SQL function:
SQL
The syntax of this SQL function can differ from one SQL database to another, so you might need to adapt it.
Calculate the Bayesian average for each product
The variablesavg_stars_rating and ratings_count match the attributes in the that represent, respectively, the rating average and quantity of ratings for each product:
JavaScript
1
Create function for calculating Bayesian averages
Using all four variables, this function generates the Bayesian average for a single product:
JavaScript
2
Add Bayesian average to each record
Perform the calculations for every product. You can do this by:
- Retrieving every product in the index, using the
browsemethod. - Running them through the preceding Bayesian average function to calculate their Bayesian average
- Updating the index with their new values
JavaScript
Full example
JavaScript
Frequency and methods of updating the Bayesian average
As users rate products, their Bayesian average changes—but not necessarily with every new rating. Here’s some guidance on how often to update the Bayesian average. For calculating the Bayesian constants (m and C),
you can create a batch job that runs once per week or once per month.
These constants don’t need to change that often.
For calculating the Bayesian average for one or more products,
you can recalculate the Bayesian average periodically during the day, every night, or once per week.
It depends on the number of ratings you get each day.
For example, Uber might want to update their drivers’ averages several times a day,
whereas Amazon might be fine with an overnight process, or once per week.
Essentially, the more often people rate your products,
the more often you should update the Bayesian average.
Because the Bayesian calculation is an average,
the values don’t change with every new rating.
Thus, recalculating after every new rating isn’t necessary.
You can recalculate Bayesian averages whenever you update your product index.
Note that because the Bayesian average affects one attribute per record,
you can do a partial update to change only the Bayesian average attribute.
Use the Bayesian average as a custom ranking
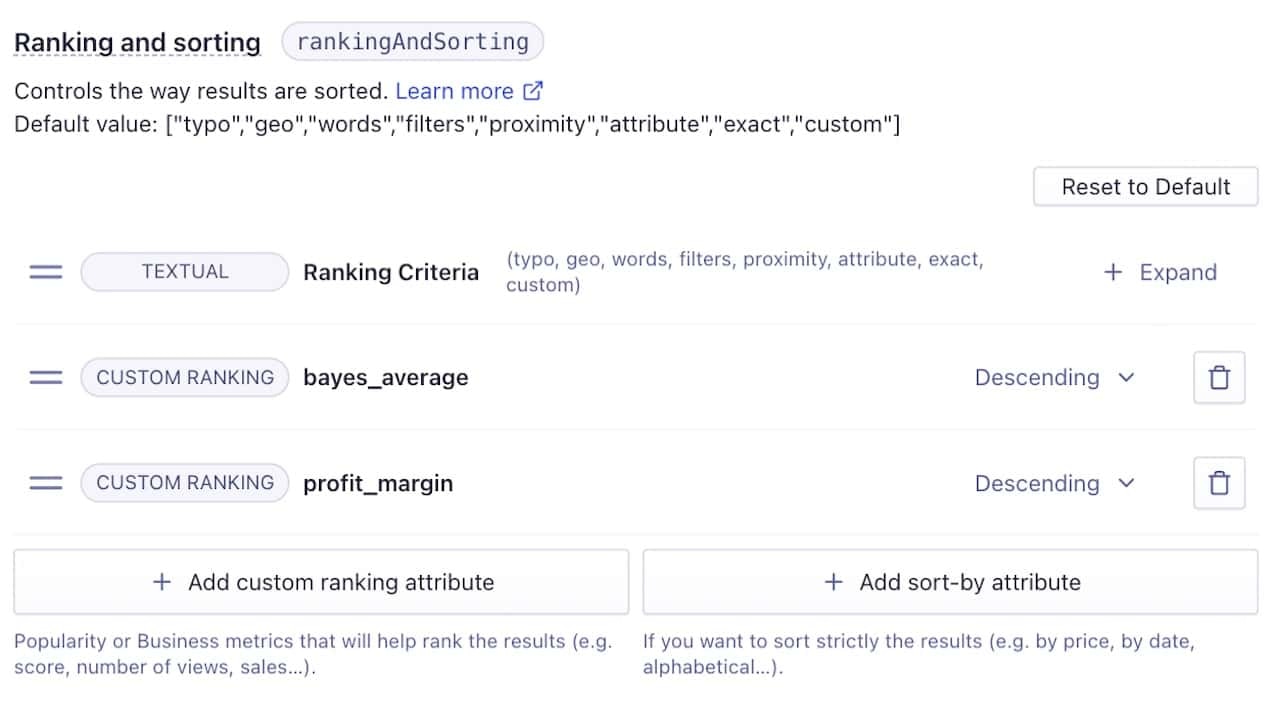
As you’ve seen, you add the Bayesian average attribute to every product. It’s used as a custom ranking attribute to rank by ratings. If you’re using the Bayesian average as a custom ranking, consider:- You can use it as a single custom ranking or combine it with other custom ranking attributes.
- Sometimes it’s better to group together items with similar Bayesian averages.
- You can add more factors to the Bayesian calculation to improve its accuracy.
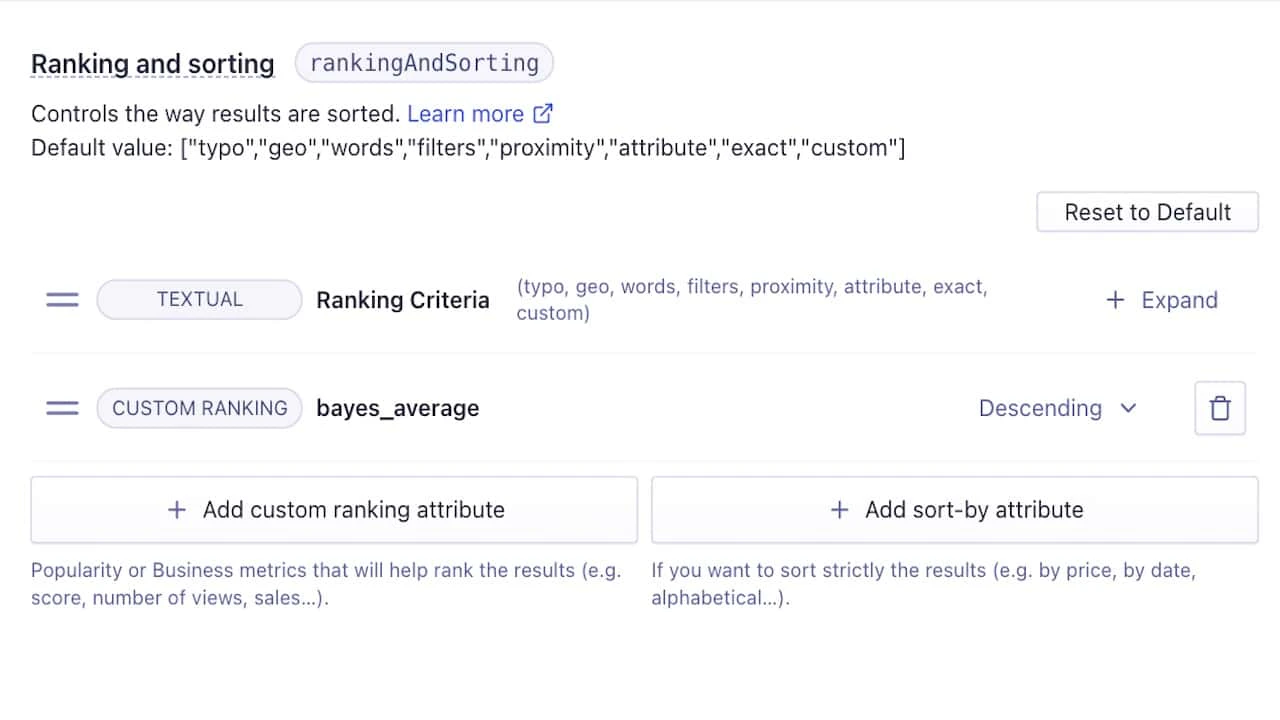
As single custom ranking attribute
Up to this point, the assumption is that the Bayesian average operates alone in ranking your results. In that case, you can use the newbayes_average attribute you’ve added in each of your records as a custom ranking value,
as seen in the following image:
Mixed with other custom ranking signals
More often, you want to add a second ranking criteria as a tie-breaker, to handle cases where two or more results have the same Bayesian average. In these cases, you can use typical business metrics, such as most sales, views, margins, or anything else. For example, if you have ten records with a Bayesian average of 4, you need a second custom ranking to break the tie between these 4’s. Here’s an example where a product’sprofit_margin acts as a secondary tie-breaker for the primary Bayesian average ranking: