Search analytics in the Algolia dashboard
To access your search analytics in the Algolia dashboard:- Go to the Algolia dashboard and select your Algolia .
- On the left sidebar, select Search.
- Select your Algolia index and go to Analytics.
- If you want to include analytics from other indices (including replicas), select Include other indices.
- If you want to segment the analytics by tags, click Toggle Analytics Tags. Select or enter a tag for filtering.
Comparison mode
To compare the performance of your metrics between different periods, click Comparison mode and select the date ranges you want to compare.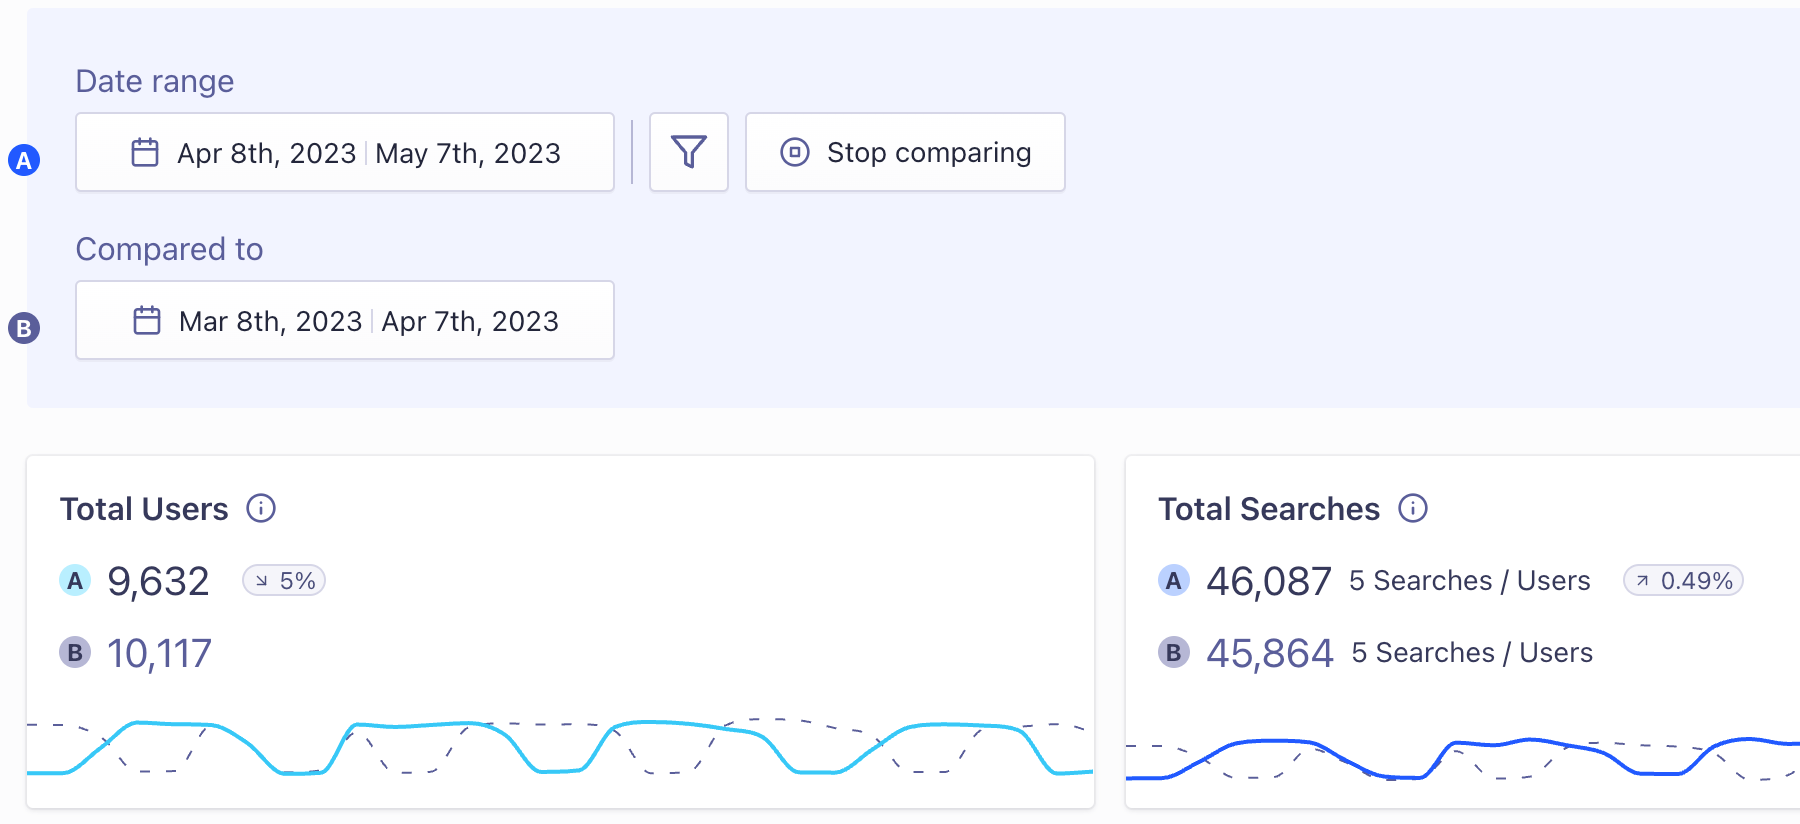
Export analytics data
To export any of the metrics from the Algolia dashboard, click Download. You can export and download your analytics data as CSV or XLSX files.Export A/B test data to an external analytics platform
By default, Algolia creates an analytics tag per A/B test variant, which you can export while filtering on these tags to view statistics in other systems. Use thegetRankingInfo parameter to retrieve the A/B test ID and variant ID.
This can help you to track user variants and behavior in third-party tools, like Google Analytics.
Click, conversion, and revenue analytics
Some metrics, such as the conversion rate, need events from your app or website. Graphs and tables that involve these metrics won’t display data until you start sending events. Revenue analytics, including add-to-cart and purchase metrics, is an optional feature.This feature isn’t available on every plan.
Refer to your pricing plan to see if it’s included.