Crawler logs help you troubleshoot crawl issues, verify site coverage, and monitor crawler performance over time. When enabled, the crawler records detailed logs for every crawl.
Enable logs
Go to the Algolia dashboard and select your Algolia .
On the left sidebar, select Data sources > Crawler .
Select the Crawler you want to configure.
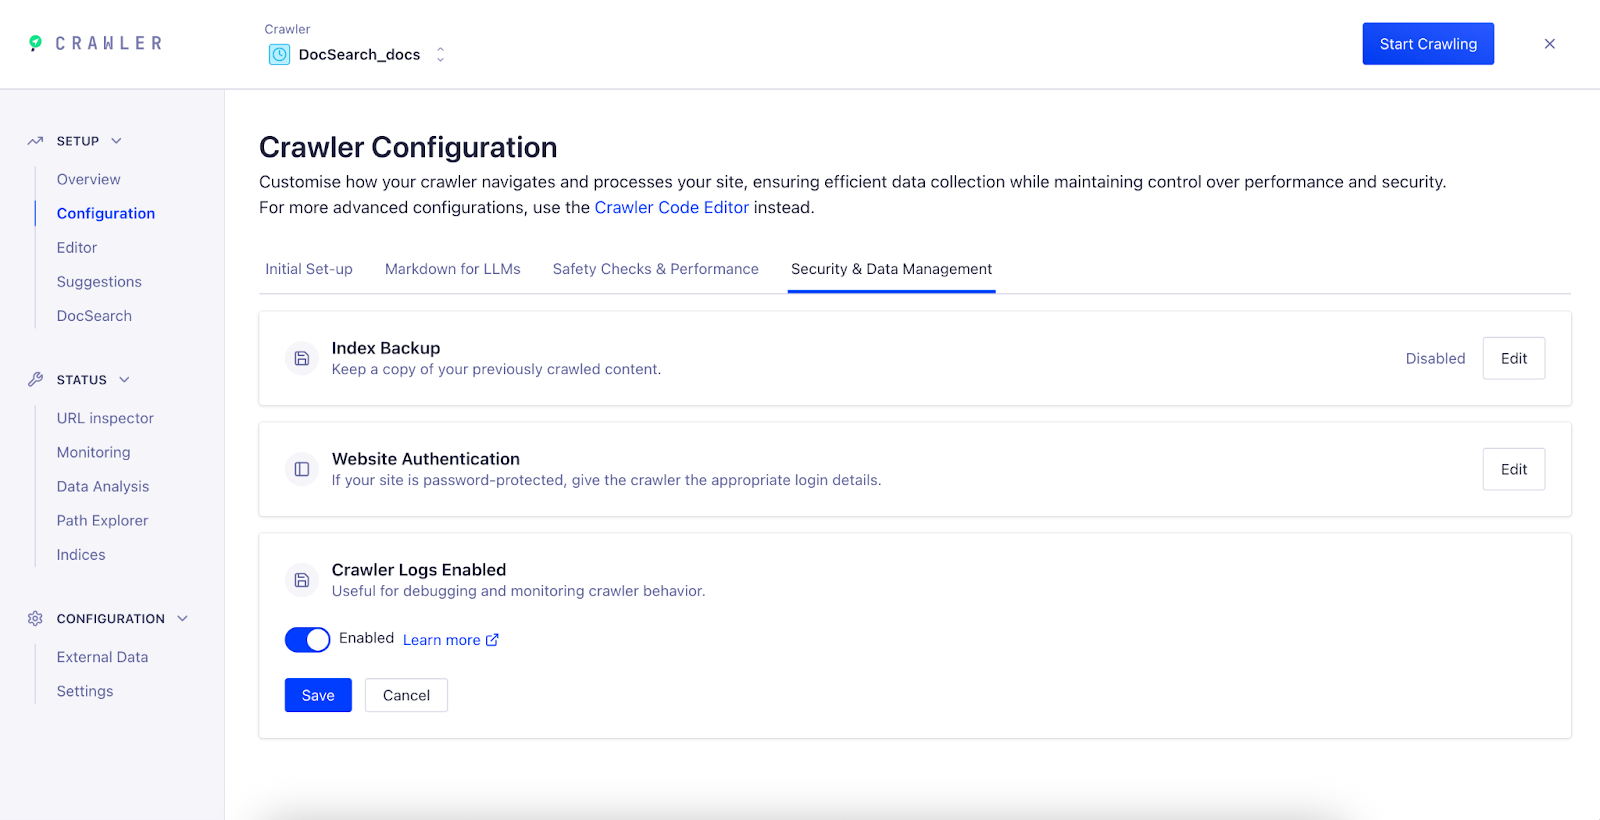
Go to Setup > Configuration and open the Security & Data Management tab.
Set the Crawler Logs option to Enabled and click Save .
After you enable logs, the crawler starts generating logs for new crawl runs. Logs aren’t available for previous crawls.
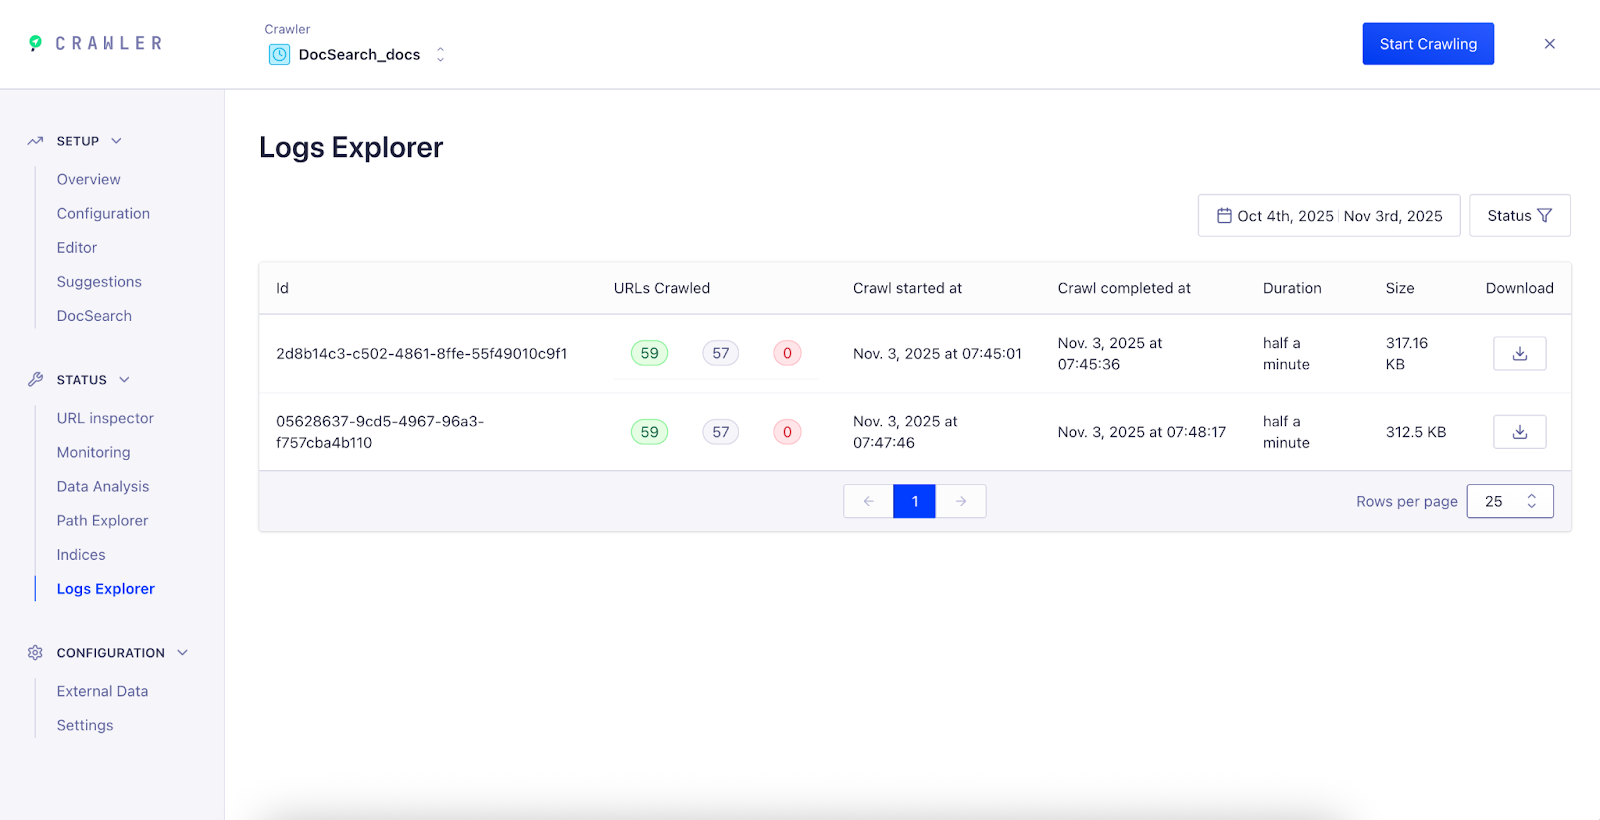
View and download logs After your next crawl completes, view or download its logs in the Logs Explorer .
In the sidebar, select Status > Logs Explorer .
Each row represents a crawl run. For each crawl, you can view:
URLs Crawled : total number of pages successfully processed.URLs Ignored : pages skipped due to configuration or filters.URLs Failed : pages that returned errors or couldn’t be accessed.Crawl Duration : how long the crawl took.Log Size : file size of the generated log.
Click the Download icon to export the full crawl log.
Last modified on May 19, 2026